
PFAS emissions to air: the forgotten pathway
In this briefing note, we explore what PFAS are, why they are considered an environmental risk, and why their unique physicochemical properties increase the complexity of environmental impact assessments for this group of compounds in the context of this pathway.

Logika Group Local Authority Carbon Budget Tool
The Logika Group Local Authority Carbon Budget Tool allows users to view recommended carbon emission budgets at the local authority level.

Local Authority Carbon Budget Tool Report
Logika Group Local Authority Carbon Budget Tool report.

Calibrating Defra’s 2021-based Background Maps
Logika Group calibrates Defra’s 2021-based background pollutant maps against 2022, 2023 and 2024 measurements

Impacts of Emergency Generator Testing and Maintenance
An analysis of the impacts of emergency generator testing and maintenance on short-term nitrogen dioxide concentrations

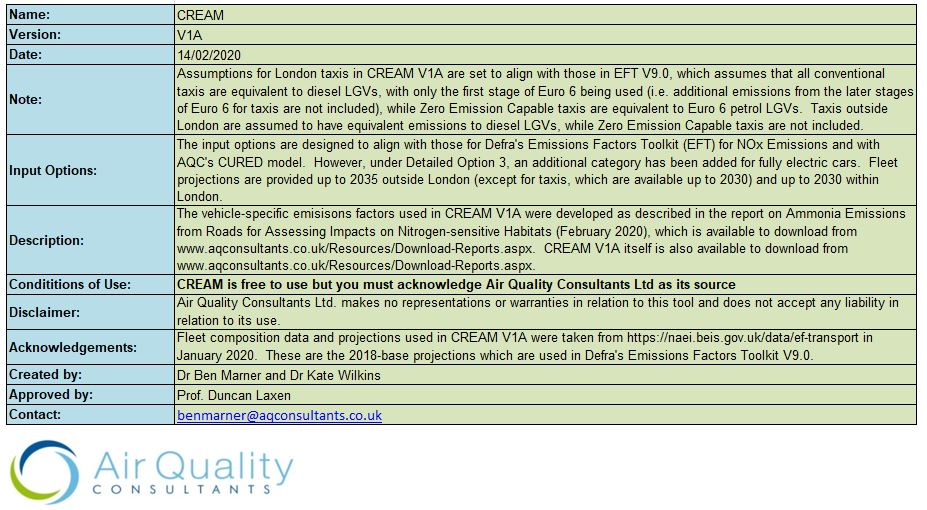
Calculator for Road Emissions of Ammonia CREAM V2A
Version 2 of the CREAM model used to calculate ammonia emissions from road vehicles.

Development of CREAM Emissions Model Version 2
Report describing the evidence which underpins Version 2 of the CREAM model
Calibration of Defra's 2018-based background NOx and NO2 maps against 2022 measurements
Calibration of Defra's 2018-based background NOx and NO2 maps against 2022 measurements

We Are The Logika Group
The Logika Group provides clients with a broad range of high quality environmental and design consultancy services.
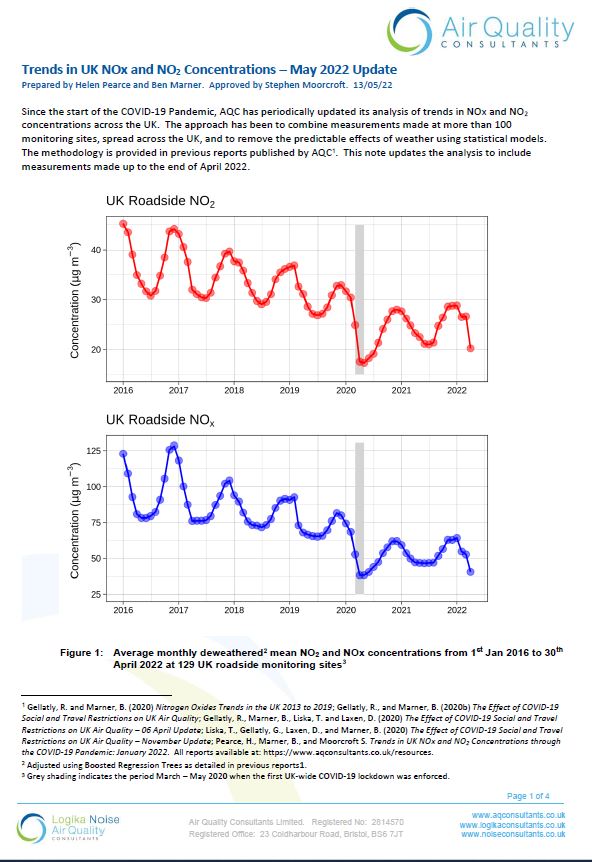
AQC updates its analysis of NOx and NO2 trends
AQC has updated its analysis of long-term NOx and NO2 trends across the UK, which now runs to the end of April 2022.
AQC updates its analysis of NOx and NO2 trends, including through the COVID pandemic
Analysis of trends in NOx and NO2 at 219 monitoring sites across the UK, over six years to December 2021, showing the effects of COVID lockdowns in the context of long-term patterns.
The Potential Wider Environmental Effects of Industrial Decarbonisation
AQC has explored the challenges of industrial decarbonisation, the technologies coming forward, the potential for air quality and climate change trade-offs, and other cross media effects associated with the introduction of these technologies.
Clean Air Day 17th June 2021
On Clean Air Day 2021, Steve Moorcroft and Tim Williamson of Air Quality Consultants Ltd reflect
on the changes in air quality and air quality policy over the last 25 years, and the challenges still with us.
Attaining Lockdown Air Quality without the Lockdown
The air quality changes brought about by the unprecedented lockdown of European cities during the Covid-19 pandemic can be replicated through changes to mobility policies, research released by AQC has shown.
The Effect of COVID-19 Social and Travel Restrictions on UK Air Quality - November Update
Air Quality Consultants Ltd has updated its analysis of the impacts of COVID-19 social and travel restrictions on air quality.
Comparison of EFT v10 with EFT v9
Note comparing EFT v10 with EFT v9 and considering the implications in terms of the need for sensitivity testing around future vehicle emissions
Calibrating Defra’s 2018 based Background NOx and NO2 Maps against 2019 Measurements
Calibration of Defra's 2018-based background NOx and NO2 maps against 2019 measurements.
Calibrating Defra’s 2017 based Background NOx and NO2 Maps against 2019 Measurements
Calibration of Defra's 2017-based background NOx and NO2 maps against 2019 measurements.
AQC Responds to Defra call for Evidence on Air Quality Changes as a Result of COVID-19 Lockdown
AQC has updated its analysis of the impacts of the COVID-19 social and travel restrictions on air quality in response to Defra’s call for evidence. NOx and NO2 concentrations at the roadside have fallen by ~30% on average, and roadside ozone concentrations have increased following the lockdown.
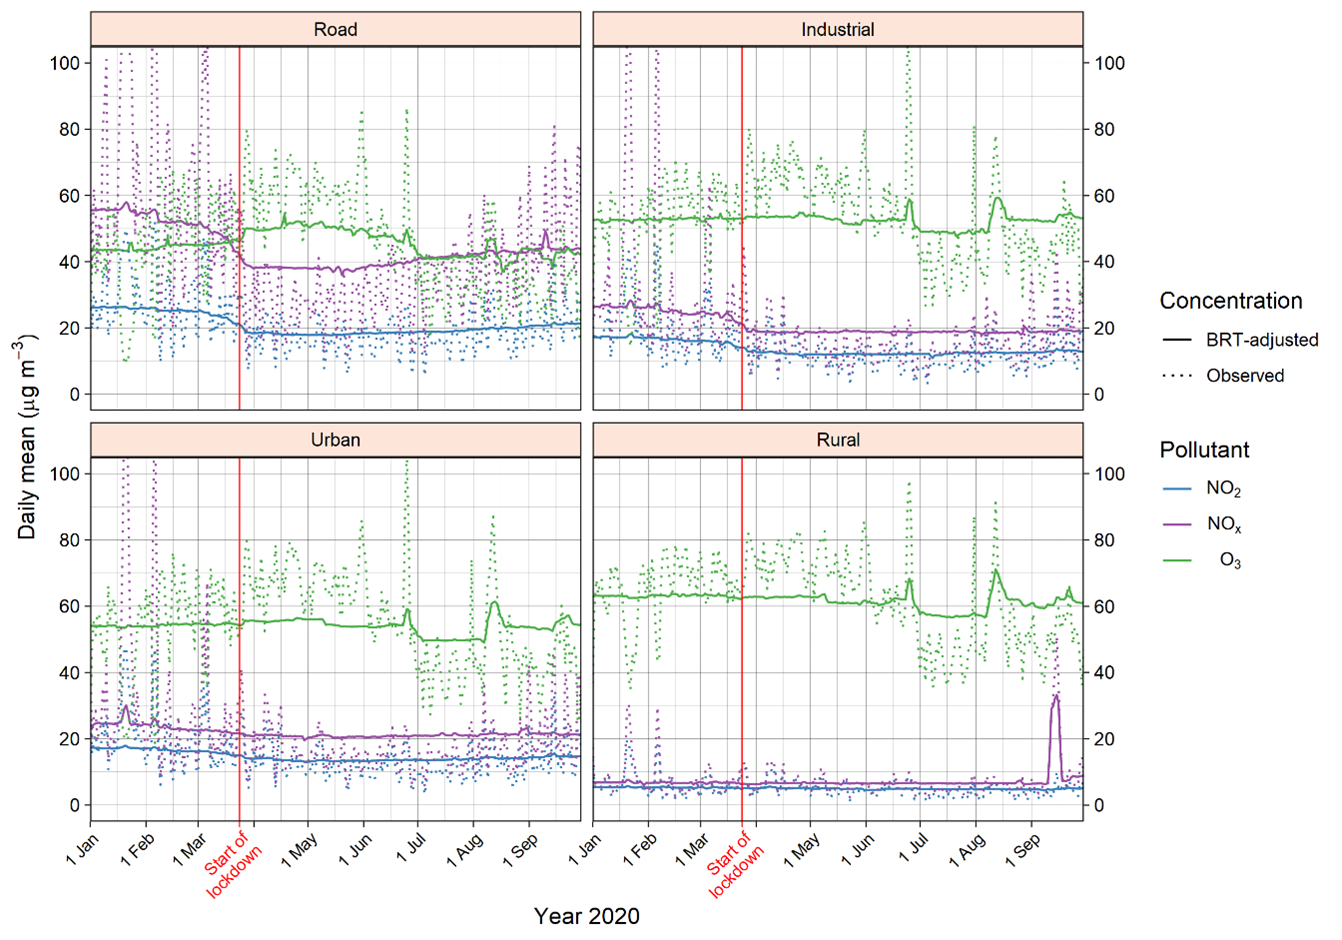
AQC Analysis Isolates Changes in Pollutant Concentrations at 247 Sites Across the UK as a Result of COVID-19
AQC has further updated its analysis of the impacts of COVID-19 social and travel restrictions on air quality. Isolating and removing meteorological and temporal effects has revealed significant reductions in NOx and NO2 concentrations at a very large number of monitoring sites across the UK.
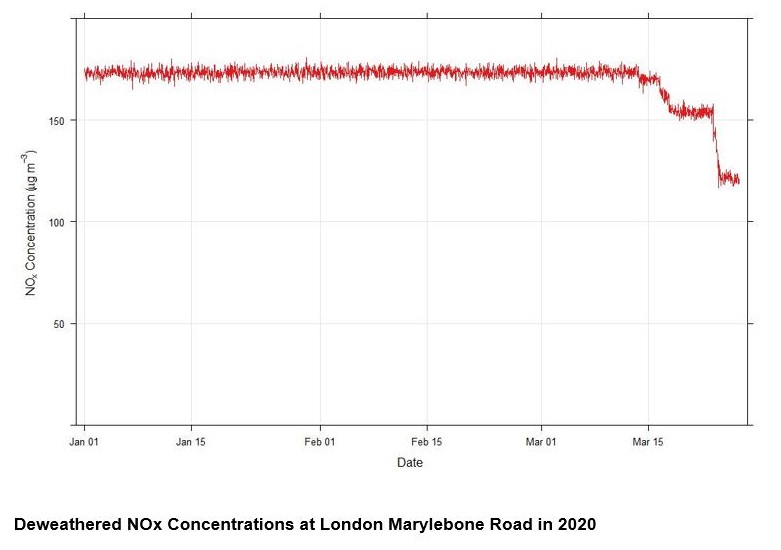
AQC Analysis Identifies Substantial Reductions in Roadside Pollutant Concentrations as a Result of COVID-19 Social and Travel Restrictions
AQC has updated its analysis of the impacts of COVID-19 social and travel restrictions on air quality, demonstrating a substantial reduction in NOx and NO2 concentrations, with concentrations at Marylebone Road reducing by as much as 30% for NOx and 20% for NO2.
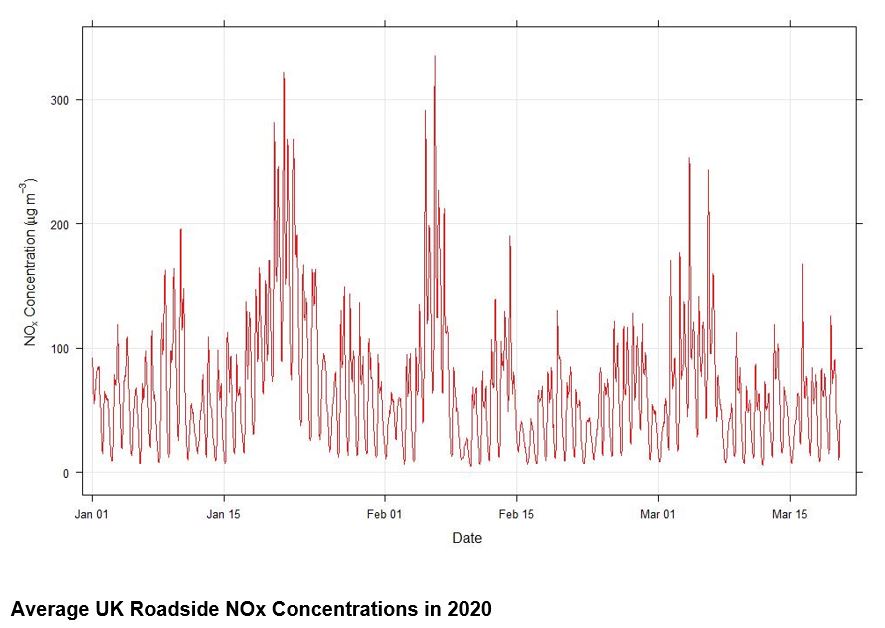
The Effect of COVID-19 Social and Travel Restrictions on UK Air Quality
Air Quality Consultants Ltd has analysed trends in air quality over the year to date to investigate whether the recently implemented COVID-19 social and travel restrictions have influenced air quality across the UK.
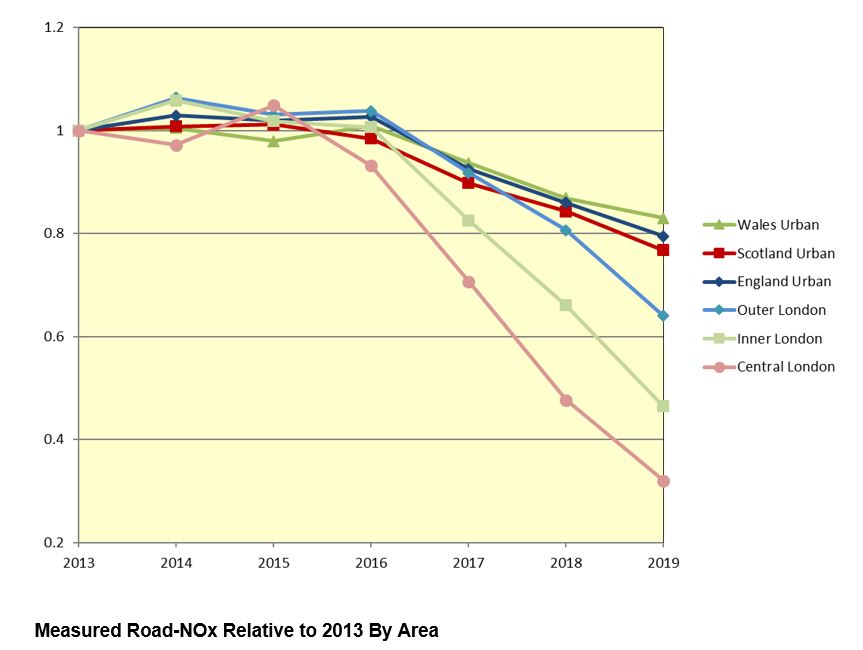
Performance of Defra’s Emission Factor Toolkit 2013-2019
Air Quality Consultants Ltd has demonstrated that reductions in NOx emissions from motor vehicles predicted by Defra’s Emission Factor Toolkit now broadly match measured data at roadside monitors. This means Air Quality Consultants’ CURED model is no longer required.
Calculator for Road Emissions of Ammonia CREAM V1A
An MS Excel spreadsheet for calculation of ammonia emissions from road vehicles.
Ammonia Emissions from Roads for Assessing Impacts on Nitrogen-sensitive Habitats
Report discussing the importance of traffic-related ammonia emissions when calculating nitrogen deposition. Also describes the development of the CREAM V1A model.
NOx Trends in the UK 2013 to 2019
Analysis of nitrogen oxides concentrations trends at road, urban and rural sites across the UK between 2013 and 2019
NO2 and NOx Trends in the UK 2005 to 2018
Analysis of nitrogen dioxide and nitrogen oxides concentrations trends at road, urban and rural sites across the UK between 2005 and 2018
Calibrating Defra’s 2017 based Background NOx and NO2 Maps against 2018 Measurements
Calibration of Defra's 2017-based background NOx and NO2 maps against 2018 measurements.
Initial-Comparison-of-EFT-v9-with-EFT-v8-and-CURED-v3A-290519
Note comparing EFT v9 with EFT v8 and CURED v3A
Final Report on Diffusion Tube Bias Adjustment
Report for the Scottish Government examining bias-adjustment factors for correcting nitrogen dioxide diffusion tube results as used by Scottish Local Authorities.
Literature Review on Diffusion Tube Bias
Literature review for Scottish Government on factors affecting diffusion tube bias.
2017 Background Map Calibration
Calibration of Defra's background NOx and NO2 maps against 2017 measurements.

NO2 and NOx trends in the UK 2005 to 2016
Report summarising the results of a detailed analysis of nitrogen dioxide and nitrogen oxides trends in the UK between 2005 and 2016.
Calculator Using Realistic Emissions for Diesels CURED V3A.
An MS Excel spreadsheet for calculation vehicle emissions. Previous versions (CURED V1A and CURED V2A) are still available on request.
Adjusting Background NOx and NO2 maps for CURED V3A
Updated factors for deriving background NOx and NO2 concentrations for use with CURED V3A
Development of CURED V3A
Note explaining the reasoning behind the CURED V3A emissions model and how it is formulated.
CURED V2A Compared to COPERT 5.0
High-level comparison of the CURED V2A tool against the emissions from COPERT 5.0
2016 Background Map Calibration
Calibration of Defra's background NOx and NO2 maps against 2016 measurements
Air Quality Objectives and Occupational Air Quality Standards
Relationship between the UK Air Quality Objectives and Occupational Air Quality Standards
Note on EFT7 and CURED2A Comparison August 2016
Note providing a high-level comparison of predictions using EFT V6.02, EFT V7.0, CURED V1A and CURED V2A.
Adjusting Background NO2 Maps for CURED September 2016
Report setting out an approach to deriving background NOx and NO2 concentrations for use with the CURED V2A calculator. This has been updated from the version which accopanied Version 1A of CURED and uses factors which are specific to Version 2A of the calculator.
Emissions of Nitrogen Oxides from Modern Diesel Vehicles
Report summarising the results from recent real-world emissions tests, providing comparisons with the COPERT model and Defra’s Emissions Factors Toolkit, and describing a reasonable worst-case sensitivity test for future-year modelling. Used to derive the CURED calculator.
Combining Instantaneous Vehicle Emission Calculations with Dispersion Modelling to Identify Options to Improve Air Quality in Reigate and Banstead
Report on dispersion modelling with instantaneous vehicle emissions prepared for Reigate & Banstead Borough Council under a grant from Defra, September 2014.
GLA-AQ-Neutral-Policy-Final-Report-April-2014-J1605
Report supporting the London Mayor's Air Quality Neutral Policy methodology
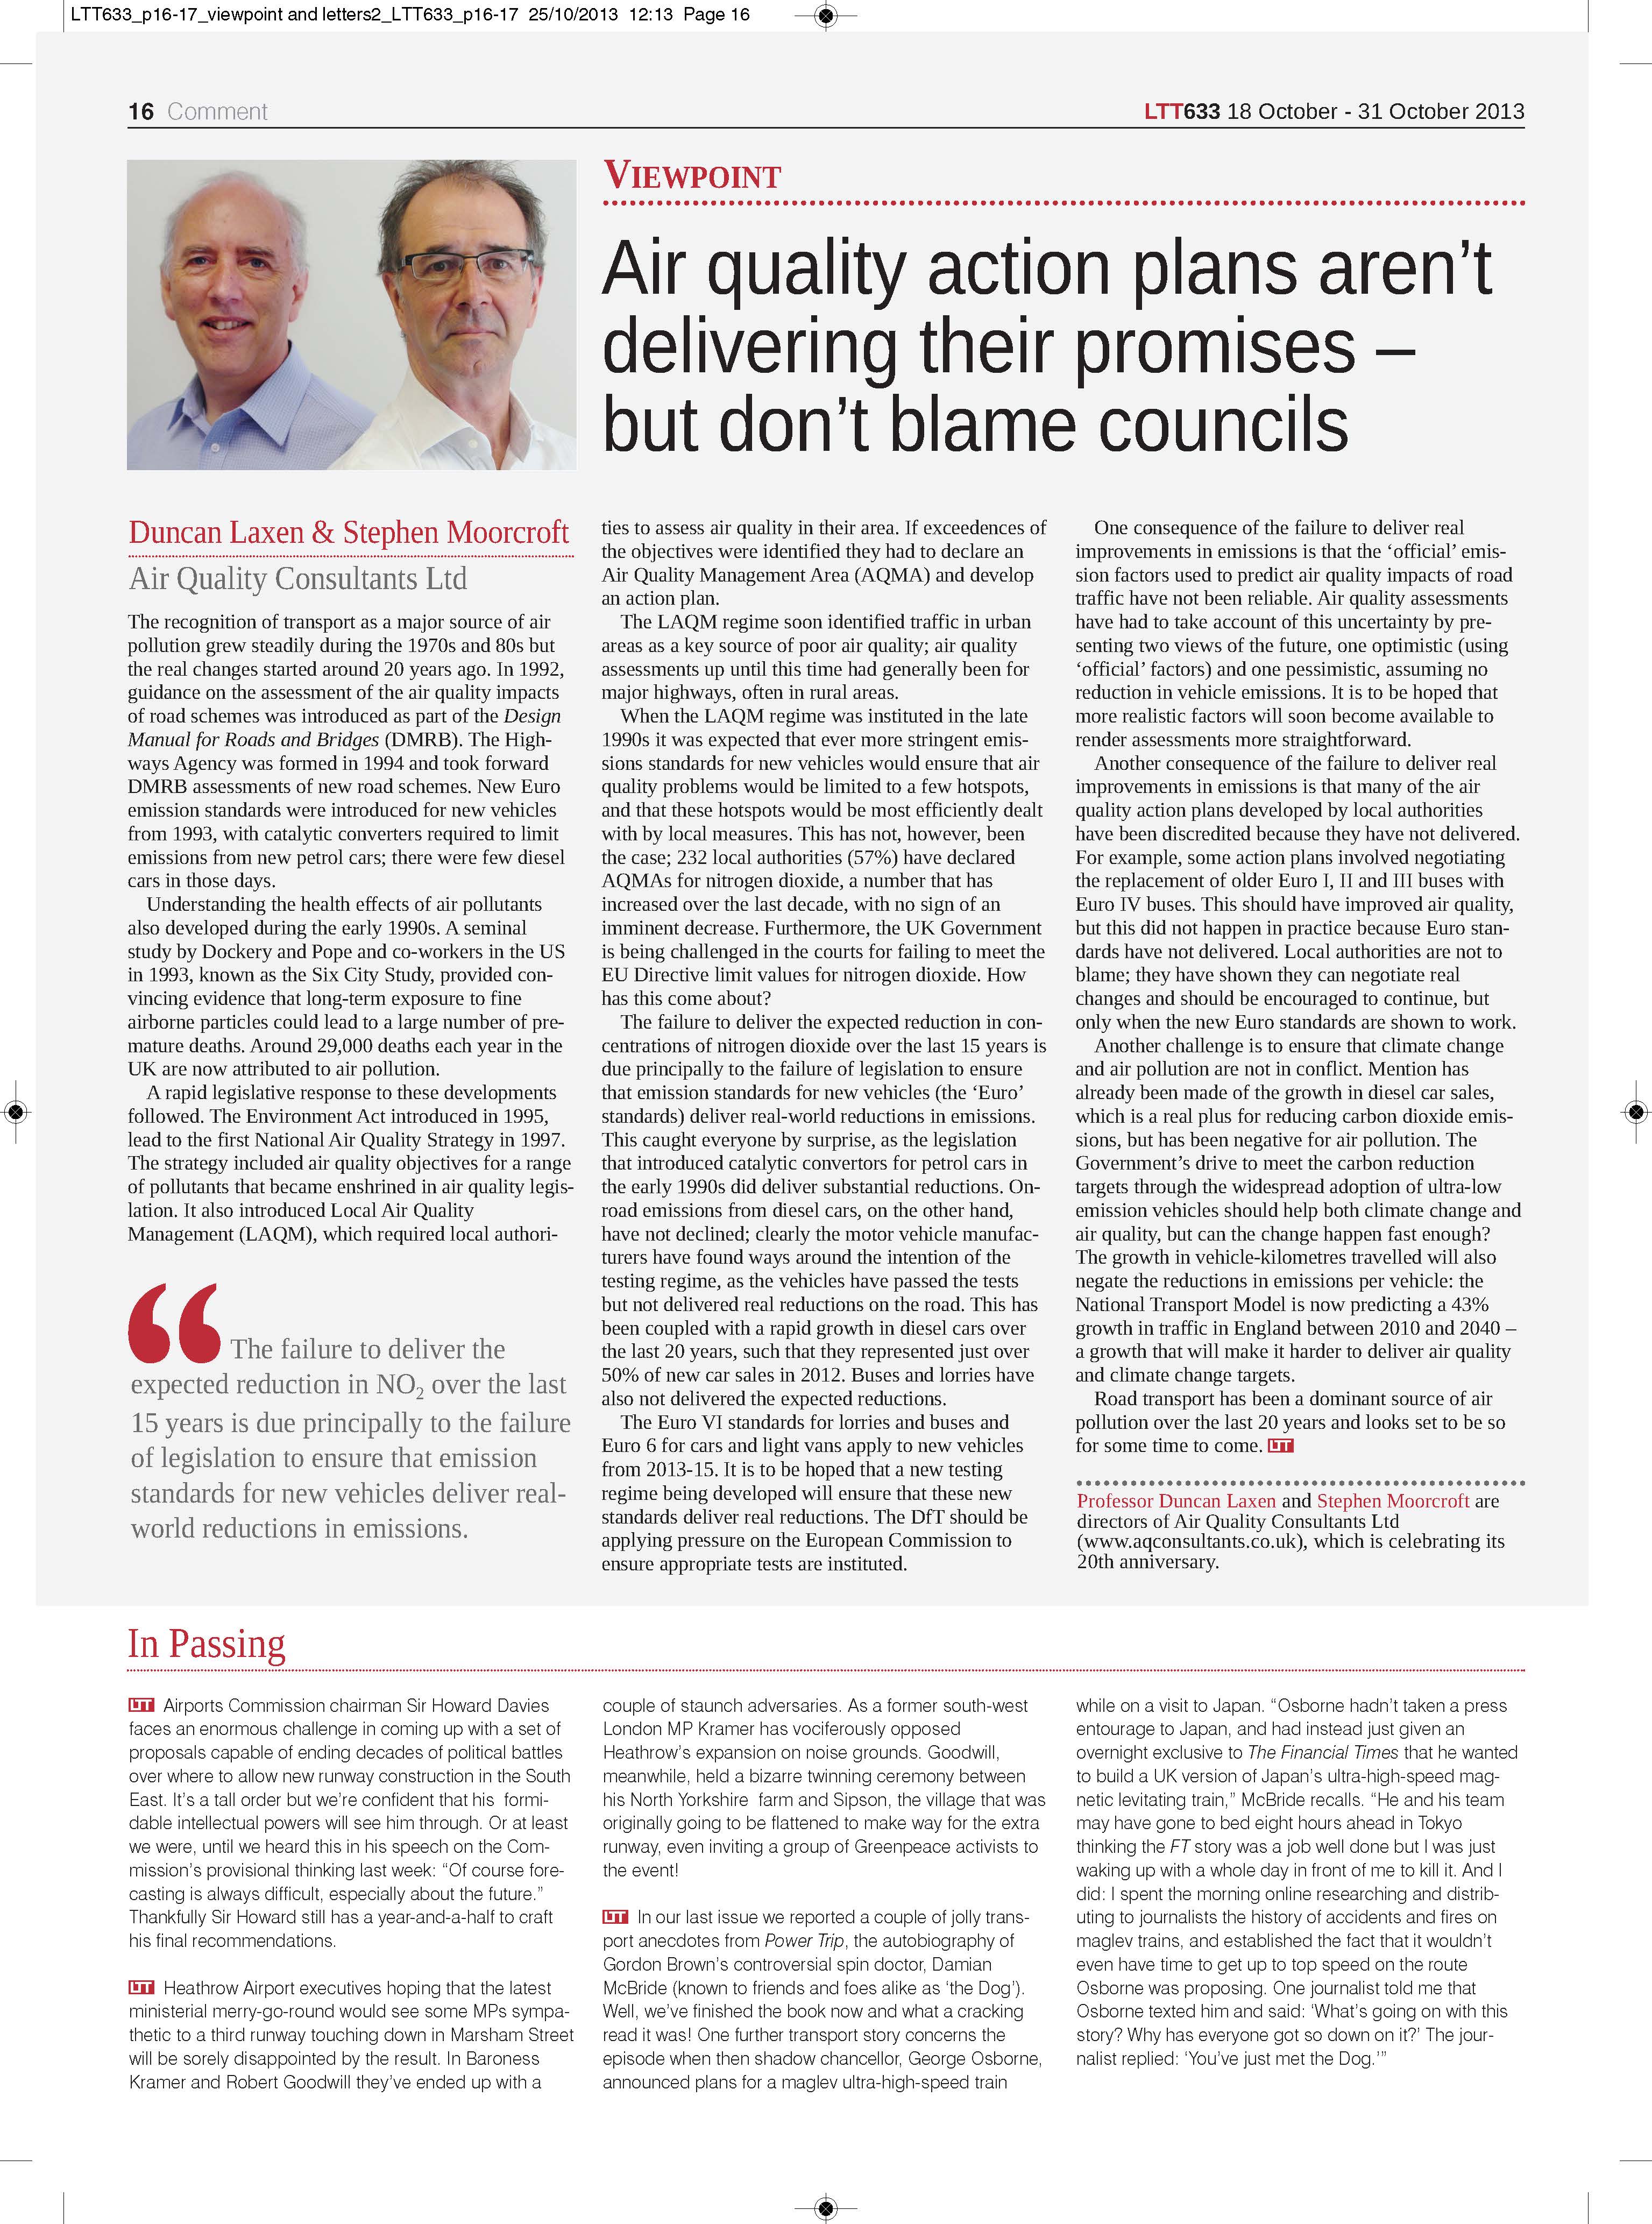
Article for LTT, October 2013
Prof.Duncan Laxen and Stephen Moorcroft have an article published in Local Transport Today on the role of motor vehicles and air pollution over the last 20 years
Report prepared for Defra, June 2013
Examples of Air Quality Action Plan Measures
Report prepared for the Scottish Environment Protection Agency, July 2012
PM2.5 in the UK - Full Report.
Report prepared for UK Environment Agencies, December 2010.
PM2.5 in the UK - Full Report.
Report prepared for UK Environment Agencies, December 2010.
PM2.5 in the UK - Summary Report.
Presentation: What advice for modelling future nitrogen dioxide
Presentation 'What advice for modelling future nitrogen dioxide" by Prof. Duncan Laxen at Dispersion Modellers User Group meeting in London on 1 December 2010.
Report prepared for Transport for London (2010)
Local Measures for NO2 Hotspots in London. Produced with TRL Ltd to inform development of the Mayor’s Air Quality Strategy. It does not take account of the final Strategy, nor any revised modelling work or information subsequent to completion of the report in March 2010.
Report prepared for Transport for London (2009)
Local Measures for PM10 Hotspots in London. Produced with TRL Ltd to inform development of the Mayor’s Air Quality Strategy. It does not take account of the final Strategy, nor any revised modelling work or information subsequent to completion of the report in December 2009.
Report prepared for Defra (2009).
Review of Bus Fleet Compositions and Implications for Emissions Reduction Strategies
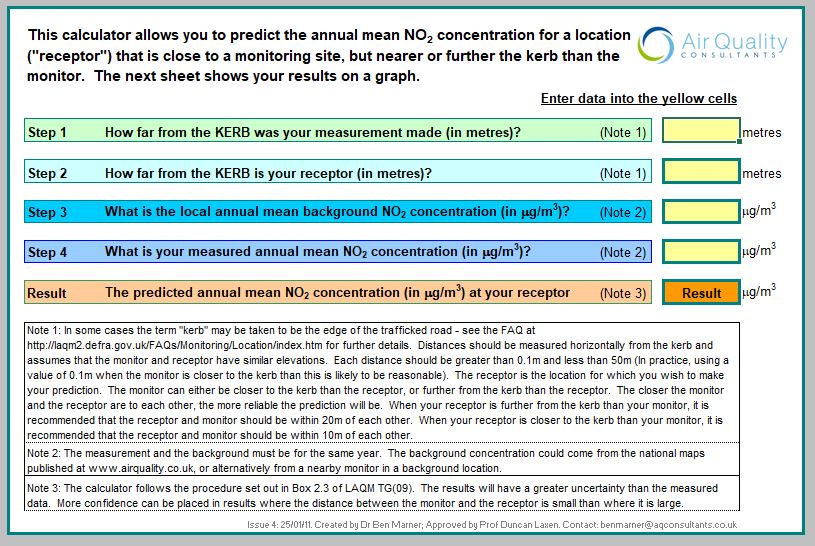
MS Excel spreadsheet for calculation of the fall-off with distance of roadside NO2.
This calculator allows users to predict the annual mean NO2 concentration for a location (“receptor”) that is close to a monitoring site, but nearer or further from the kerb than the monitor.
Report prepared for Defra (2008).
Report supporting the NO2 with Distance from Roads Calculator.
Report prepared for Defra (2007).
Analysis of Fast-Response NOx Measurements at Heathrow Airport
Report prepared for Defra, March 2006
Options for an Exposure-Reduction Approach to Air Quality Management in the UK
Report prepared for Defra (2006)
Relationship Between Diffusion Tube Bias and Distance From the Road
Report prepared for Defra (2005).
Options for an Exposure-Reduction Approach to Air Quality Management in the UK and the EU for Non-Threshold Pollutants
Report prepared for Dorset Waste Planning Authority (2005).
An Assessment of Possible Air Quality Impacts on Vegetation from Processes Set out in the Bournemouth, Dorset & Poole Waste Local Plan
Report prepared for Defra (2004).
Was 2003 an Exceptional Pollution Year? UK Trends in Nitrogen Dioxide, Nitrogen Oxides and PM10 Concentrations.
Report prepared for Defra (2003)
Analysis of the Relationship Between 1-Hour and Annual Mean Nitrogen Dioxide at UK Roadside and Kerbside Monitoring Sites
Report prepared for Defra (2002)
Evaluation of the First Round of the Local Air Quality Management Process
Report prepared for Defra (2002)
Compilation of New Roadside Monitoring Data Obtained by Local Authorities as Part of the Review and Assessment Process - UPDATED
Report prepared for Defra (2002)
Compilation of Diffusion Tube Collocation Studies Carried out by Local Authorities